- Laboratory Analyzers
- OptiMVD Mini Viscometer and Density Analyzer
- 70Xi Series Pour, Cloud and Freeze Point Lab Analyzer
- 70Xi Series Cloud, Pour and Freeze Point Single Shot Analyzer
- 70Xi Series Cloud, Pour and Freeze Point Autosampler System
- JFA-70Xi Jet Fuel Freeze Point, Viscosity and Density Analyzer
- DFA-70Xi Diesel Fuel Cloud & Pour Point, Viscosity and Density Analyzer
- WAT-70Xi Wax Appearance Temperature Crude Oil Analyzer
- Service & Support
- Other Applications
- About Us
Specialty Applications
Phase Technology is acknowledged worldwide as the leading manufacturer of high precision, user-friendly phase detection analyzers. We are a partner that you can rely on for problem-solving, innovation and outstanding service.
Phase Technology’s patented design principles go beyond cold flow testing of petroleum products. Our technology can adapted for testing a wide variety of liquid materials. Tests include cloud, pour and freeze point; melting point, solid and titer point; turbidity and LCST (lower critical solution temperature). Specialty applications include:
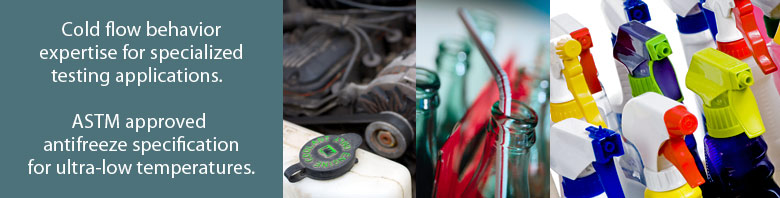
- Antifreeze engine coolants
- Surfactants: household detergents; industrial cleaners; personal care and cosmetic products; paints and coatings
- Food oils
- Citrus oils
- Industrial chemicals
- Drilling fluids
- Fire-fighting foam agents
- Tall oils
- Phase Change Material (PCM)
- Pure solvents (Paraxylene or p-xylene)
- Water treatment chemicals
- Fertilizers
- Plastic and resin polymers
- Polymers & esters
- Copolymers
- Antifreeze Engine Coolants
- Surfactants
- Food Oils
- Citrus Oils
- Industrial Chemicals
- Drilling Fluids
- Foam Agents
- Tall Oils
- PCM
Antifreeze Engine Coolants
Materials
- Ethylene glycol (EG)
- Propylene glycol (PG)
- Ethanol antifreeze (EAF)
Tests Needed
- Freeze point
- Pour point
Solutions
Phase Technology leads the industry with the world’s first and only automatic freeze point analyzer for engine coolants. Users can be confident that their test results are accurately measured by ASTM D6660, the only automatic method that is approved by and included in ASTM International standards for antrifreeze: ASTM D3306 and D4985.
Coolant manufacturers, packagers, research and inspection laboratories, government agencies and many other facilities derive significant benefits from using Phase Technology's freeze point analyzers for antifreeze. With Phase Technology 70Xi analyzer, test time is reduced to only 10 minutes—a substantial time savings when compared to the manual method.
Sample Test Results
Antifreeze: freeze point
Phase Technology's 70Xi analyzer generates a phase plot for each test. The phase plot graphs the scattered light signal received by the optical detectors as a function of temperature during the entire test, so that the users can easily review what the thermal trajectory and the freezing/melting behavior of the samples.
Here is a freeze point phase plot for a 45% Ethylene Glycol and water mixture tested on a Phase Technology 70Xi analyzer::
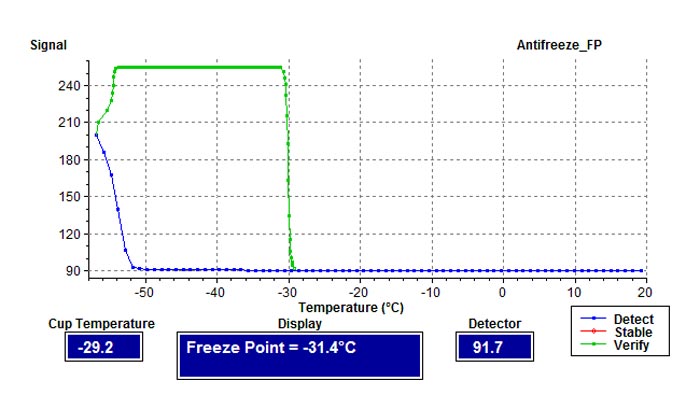 Shown in the above phase plot is the light signal level received by the analyzer as the sample temperature changes during the freezing point test. Starting from the right hand side of the plot (i.e. warm temperature), the test begins by fast cooling the sample until crystals are formed. This is represented by the blue line on the phase plot.
At around -48°C, signal starts to increase (i.e. a rise on the blue line). Once sufficient crystals are formed (i.e. light signal level reaching a threshold), the temperature reverses direction and the sample is warmed at a slower rate until crystals starts to melt. The warming stage is represented by the green line.
For aqueous samples, the freezing point is defined at the temperature when a steep and sustained decrease in signal takes place. For this particular sample, this was observed at -31.7°C.
Brochure
Click here to download a Phase Technology 70Xi Antifreeze Analyzer brochure.
Surfactants (Household Detergents; Industrial Cleaners; Personal Care and Cosmetic Products; Paints and Coatings)
Materials
- Surfactants
- Aqueous solutions
- Detergents
Tests Needed
- Cloud point
- Freeze point
- Pour point
- Gel point
Solutions
Surfactants find multitudes of usage in household detergents, personal care products, industrial cleaners, paints and coatings. One particular type, the nonionic surfactants, is subject to a formation of a new surfactant-rich phase usually at an elevated temperature called the cloud point. The cloud point then, is the temperature at which a surfactant becomes insoluble in water as the sample is warmed. This parameter is important, for example, when designing detergents for use in hot water.
Cloud point phenomenon in water-surfactant solutions is an indicator of relative solubility, and plays a direct role in cleaning efficiency. Different formulations are used to adjust the cloud point to bring about the optimum balance in terms of detergency power, wash temperature and duration. It is generally assumed that maximal detergency power is achieved just below the cloud point (also called Krafft point in some situations). Frequently there are constraints on available temperature (e.g. cold water wash to preserve energy, or some upper temperature so not to damage pipes or other structures), therefore makers of surfactants aim to formulate their products to attain the cloud point to be just below this limit to have the maximally effective surfactant.
Gel point is the temperature at which the sample experiences an abrupt reduction in flow characteristics due to gelation. Phase Technology’s proprietary method disturbs the sample with a precisely-defined force at 3°C intervals (or any other user programmable interval) until movement subsides suddenly. With its advanced optical system, Phase Technology’s gel point analyzer is ideal for consumer products such as hair gel, as well as gelatin and medical agarose, for which gelling behavior is important.
Sample Test Results
Detergent: Cloud point
Similar to ASTM D2024, a sample is preheated to induce turbidity, and then cooled slowly to detect the temperature when the sample becomes clear again. Phase Technology's 70Xi analyzer generates a phase plot for each test. The phase plot graphs the scattered light signal received by the optical detectors as a function of temperature during the entire test, so that the users can easily review what the thermal trajectory and the cooling/melting behavior of the samples.
Here is a cloud point phase plot for a detergent sample tested on a Phase Technology 70Xi analyzer:
Brochure
Click here to download a Phase Technology 70Xi Surfactants Analyzer brochure.
Food Oils
Materials
- Palm oil, palm olein, palm stearin, palm kernel oil
- Canola oil
- Sunflower oil
- Edible fats
Tests Needed
- Cloud point
- Melting point
- Solid point
- Titer point
Solutions
Applications in the food industry include many standard test methods used by the American Oil Chemist Society (AOCS) and the Association of Official Analytical Chemists (AOAC).
Phase Technology’s analyzers can be configured to perform tests such as titer, cloud and melting points, winterization, nucleation and cold properties determination of oils and fats.
Beyond the detection of phase transition temperatures, our test instruments provide additional information such as the relative extent of phase separation. This is useful in indicating the extent of melting, crystallization or immiscibility at different temperatures.
Vegetable oils can sometimes develop haze or sediments due to waxes. Determination of the cloud point can aid in the winterization process. In other words, by cooling the oils to suitably low temperatures (but no colder in order to save energy), waxes can be made to precipitated out of the liquid and be removed, leaving an oil that would not haze in cold environment encountered later.
Sample Test Results
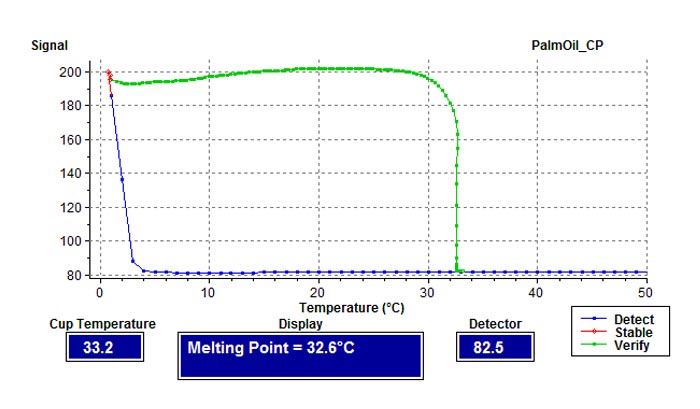
Palm oil: melting point
Phase Technology's 70Xi analyzer generates a phase plot for each test. The phase plot graphs the scattered light signal received by the optical detectors as a function of temperature during the entire test, so that the users can easily review what the thermal trajectory and the cooling/melting behavior of the samples.
Here is a melting point phase plot for a palm oil tested on a Phase Technology 70Xi analyzer:
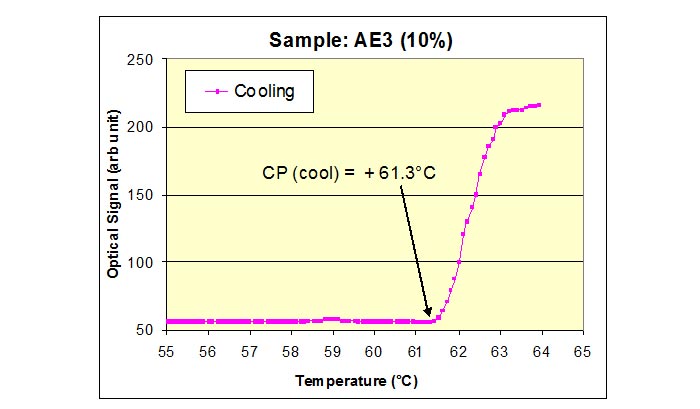
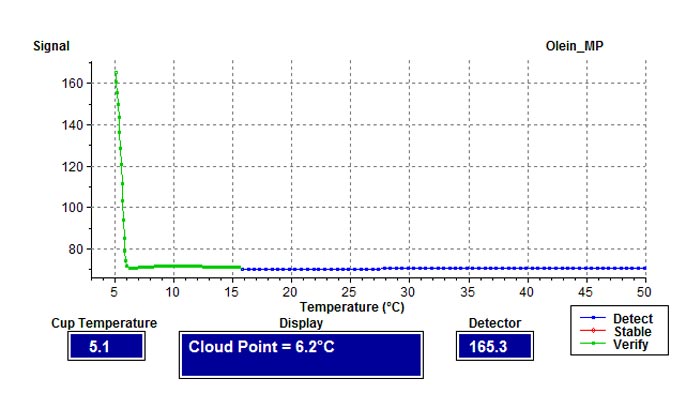
Olein: cloud point
Here is a cloud point phase plot for an olein tested on a Phase Technology 70Xi analyzer:
Citrus Oils
Materials
- Citrus oils (orange, lemon, lime, grapefruit)
Tests Needed
- Cold Soak test
Solutions
Citrus oils are extracted from fruits such as oranges, lemons, limes or grapefruits. They are typically used in the food, beverage, flavor, fragrance, cosmetics, home cleaning or even industrial solvent industry. For purposes of functional usages, appearances, and others, many citrus oils need to be winterized, i.e. the oils are cooled to low temperatures so that undesirable waxes are precipitated and subsequently filtered or removed. In this manner, the oils are termed clarified, and are accordingly quality inspected.
The cold soak test is used to determine whether winterized citrus oils have met pass/fail criterion set out by the industry, and furthermore provides a metric to measure the amount of wax/solids induced from the winterization process.
The current industrial test method tends to be lengthy and subject to human interpretation. Typically the oil is cooled to approximately 4°C (40°F) for a period of up to 2 weeks before being inspected by a human operator for indications of cloudiness and solids formation. Based on some measure of clarity as judged by the human tester, the oil is accordingly passed or failed. Ambiguities exist when the oils assume some “borderline” or marginal clarity, rendering human judgment uncertain and imprecise.
Phase Technology has worked with major global producers and processors to develop an automatic method in order to resolve these cases of uncertainties. The automatic cold soak test is the outcome of these collaborations.
Sample Test Results
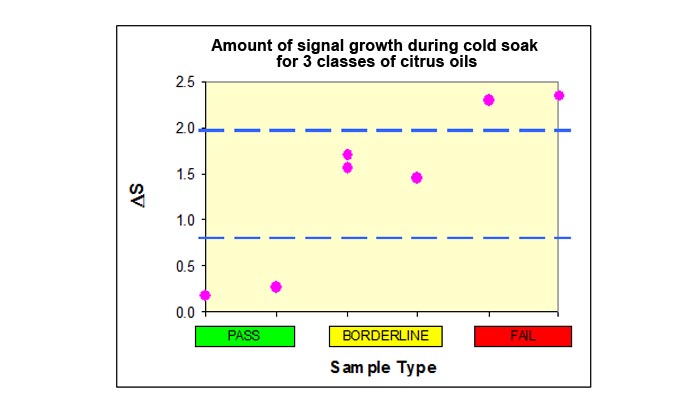
Citrus Oil: Cold soak test
The following figure illustrates the results generated from a citrus oil automatic cold soak test using a Phase Technology 70Xi analyzer.
The citrus oil sample is cooled to a suitably low temperature and soaked for a pre-defined amount of time. The amount of solids generated, as measured by the scattered optical signal, is used to determine if a sample has passed or failed.
Samples that incur a low amount of solids during the soaking process are considered a "pass," while those that exceed a pre-set threshold are considered "fail." Oils that achieve an intermediate signal growth may require additional winterization.
Industrial Chemicals
Materials
- Calcium nitrate
- Potassium acetate (KA)
- Aqueous salt
- Surfactant blend
Tests Needed
- Freeze point
- Pour point
Solutions
Industrial chemicals are often studied for the effect of different cooling or warming rates, soaking temperature and time. The Phase Temperature Control Software (PTCS), which is a special customization program available for the Phase Technology 70Xi analyzer, is perfect for this application.
PTCS software allows the user to specify individual test parameters, including target temperature, cooling/warming rate, soak time and if necessary, air pulse pressure and interval. By using PTCS, the complete phase behavior throughout the cooling and warming cycles can be fully studied.
Sample Test Results
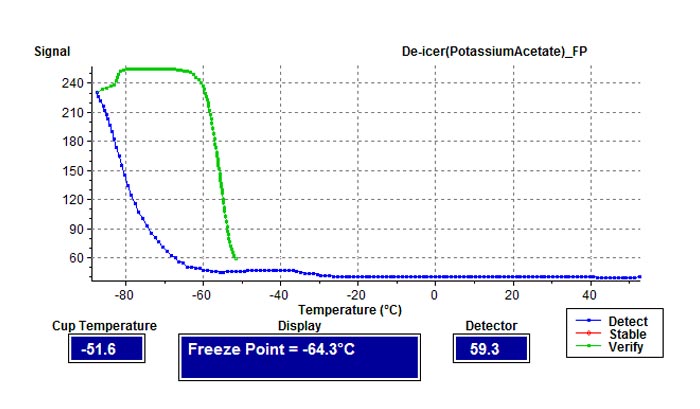
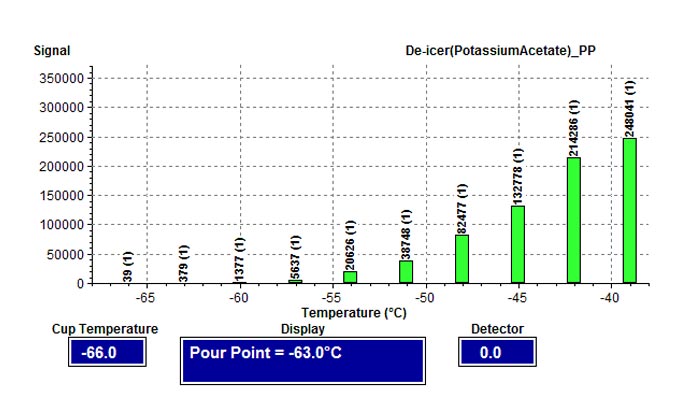
Runway De-icer, potassium acetate (KA): Freeze point
Phase Technology's 70Xi analyzer generates a phase plot for each test. The phase plot graphs the scattered light signal received by the optical detectors as a function of temperature during the entire test, so that the users can easily review what the thermal trajectory and the freezing/melting behavior of the samples.
Here is a freeze point phase plot for a potassium acetate sample tested on a Phase Technology 70Xi analyzer:
Here is a pour point phase plot for the same potassium acetate sample tested on a Phase Technology 70Xi analyzer:
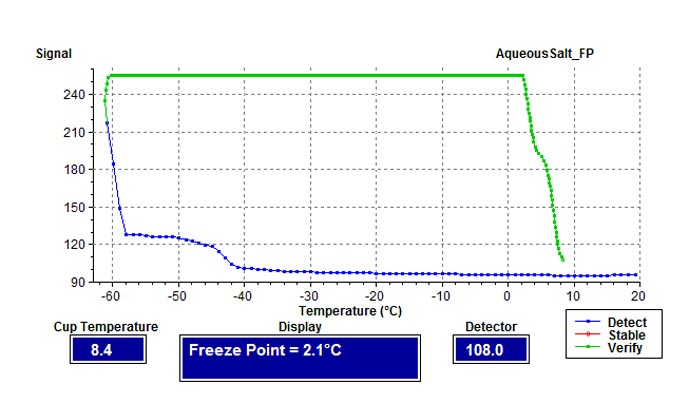
Aqueous salt: freeze point
Here is a freeze point phase plot for a aqueous salt tested on a Phase Technology 70Xi analyzer:
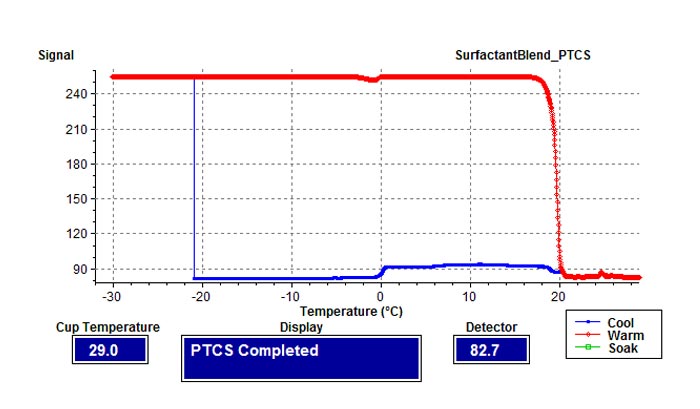
Surfactant blend: Use of PTCS analysis at user-specified cooling and warming rates
Here is a phase plot for a surfactant blend tested on a Phase Technology 70Xi analyzer and making use of PTCS software:
Drilling Fluids
Materials
- Calcium nitrate
- Calcium bromide
- Water-based emulsions
- Oil-based emulsions
Tests Needed
- Freeze point
- Pour point
Drilling fluids, also called drilling muds, are added to the well hole that is drilled for extraction of crude oil. Drilling fluids facilitate the drilling process by cooling and lubricating the drill bit, suspending cuttings, controlling pressure, and preventing the fluids from entering into the well hole. Drilling fluids may be water-based, non-aqueous, or oil-based muds.
Sample Test Results
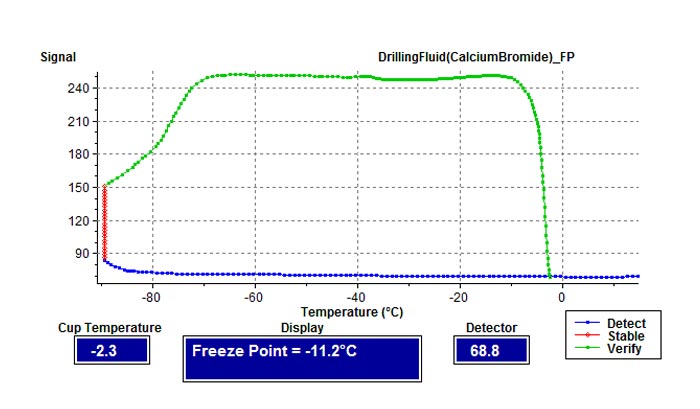
Drilling fluid (calcium bromide): Freeze point
Phase Technology's 70Xi analyzer generates a phase plot for each test. The phase plot graphs the scattered light signal received by the optical detectors as a function of temperature during the entire test, so that the users can easily review what the thermal trajectory and the freezing/melting behavior of the samples.
Here is a freeze point phase plot for a drilling fluid tested on a Phase Technology 70Xi analyzer:
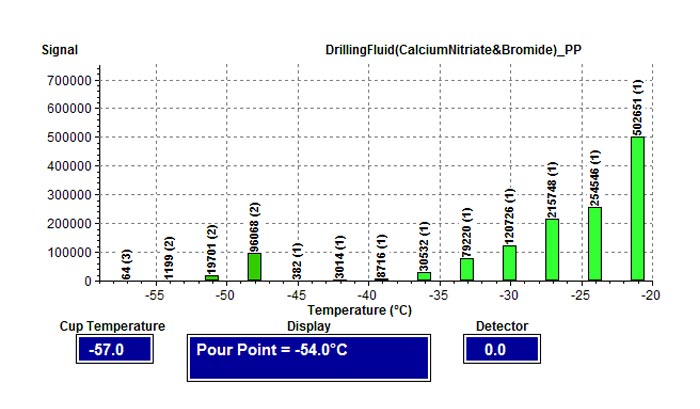
Drilling fluid (calcium nitrate and bromide): pour point
Here is a pour point phase plot for a drilling fluid tested on a Phase Technology 70Xi analyzer:
Fire Fighting Foam Agents
Materials
- Aqueous Film Forming Foam (AFFF)
- Film Forming Fluoroprotein (FFFP)
Tests Needed
- Freeze point
- Pour point
Solutions
Fire fighting foam is used for fire suppression, by forming a film that rapidly cuts off the oxygen supply and coats the fuel, resulting in suppression of the combustion. The foam has to be stored in its liquid form so it is important to measure its freeze point. Phase Technology’s analyzer is ideal for measuring the freeze point of these fire fighting foam agents.
Sample Test Results
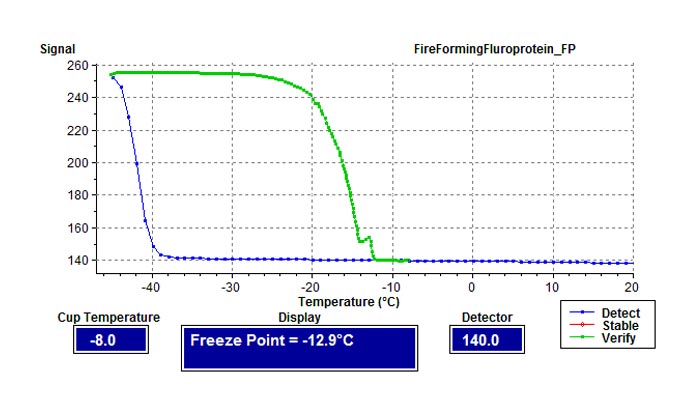
Fire Forming Fluoroprotein: Freeze point
Phase Technology's 70Xi analyzer generates a phase plot for each test. The phase plot graphs the scattered light signal received by the optical detectors as a function of temperature during the entire test, so that the users can easily review what the thermal trajectory and the freezing/melting behavior of the samples.
Here is a freeze point phase plot for a Fire Forming Fluoroprotein tested on a Phase Technology 70Xi analyzer:
Tall Oils
Materials
- Mixtures of fatty acids, resin acids, sterols
Tests Needed
- Cloud point
- Pour point
Solutions
Tall oils are used as a component of drilling fluids, adhesive, and inks; they are also used as an emulsifier. Cloud point and point point of tall oils are needed to determine the operating and storage conditions.
Researchers in tall oil related studies are often interested in experimenting with different cooling rates, target temperatures and soaking times. Phase Temperature Control Software (PTCS), a special customization program available on Phase Technology 70Xi analyzers, is perfect for this application.
The PTCS software allows the user to specify individual test parameters, including target temperature, cooling/warming rate, soak time and if necessary, air pulse pressure and interval. By using PTCS, the complete phase behavior throughout the cooling and warming cycles can be fully studied.
Sample Test Results
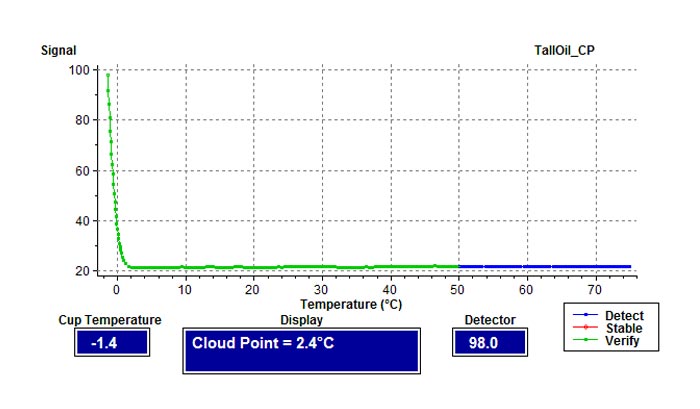
Tall oil: cloud point
Phase Technology's 70Xi analyzer generates a phase plot for each test. The phase plot graphs the scattered light signal received by the optical detectors as a function of temperature during the entire test, so that the users can easily review what the thermal trajectory and the cooling/melting behavior of the samples.
Here is a cloud point phase plot for a tall oil sample tested on a Phase Technology 70Xi analyzer:
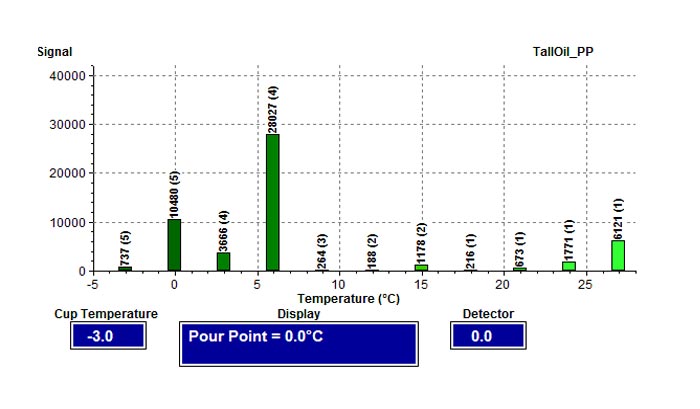
Here is a pour point phase plot for a tall oil sample tested on a Phase Technology 70Xi analyzer:
Phase Change Materials (PCM)
Materials
- Organic PCM (paraffin, fatty acids)
- Inorganic PCM (salt hydrates)
- Hygroscopic materials
Tests Needed
- Final melting point
- Thermal cycle test
Solutions
The durability of a PCM is measured with a thermal cycle, for which a PCM is frozen and melted multiple times. Phase Temperature Control Software (PTCS), a special customization program available on Phase Technology 70Xi analyzers, is perfect for this application.
The PTCS software allows the user to specify individual test parameters, including target temperature, cooling/warming rate, soak time and if necessary, air pulse pressure and interval. By using PTCS, the complete phase behavior throughout the cooling and warming cycles can be fully studied.
Sample Test Results
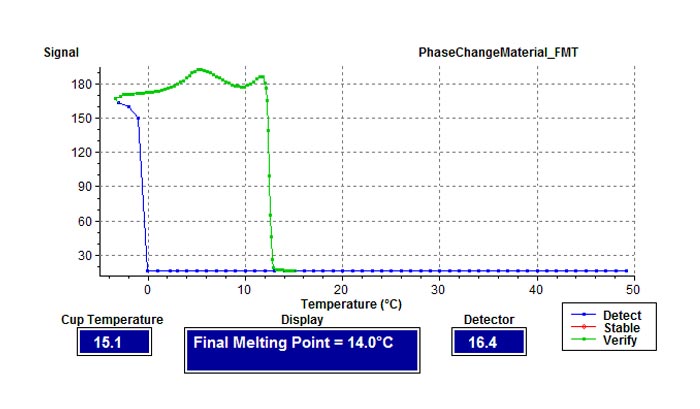
Phase Change Material: Final melting point
Phase Technology's 70Xi analyzer generates a phase plot for each test. The phase plot graphs the scattered light signal received by the optical detectors as a function of temperature during the entire test, so that the users can easily review what the thermal trajectory and the cooling/melting behavior of the samples.
Here is a melting point phase plot for a PCM sample tested on a Phase Technology 70Xi analyzer:
Support & Resources

© 2021 Phase Analyzer Company, LTD